
Command, control & complete visibility
The Fractal EMS HMI enables control, active management and monitoring, P/Q response capability, and dashboards to monitor system conditions, safety controls, and faults & alarms.
Asset & fleet management
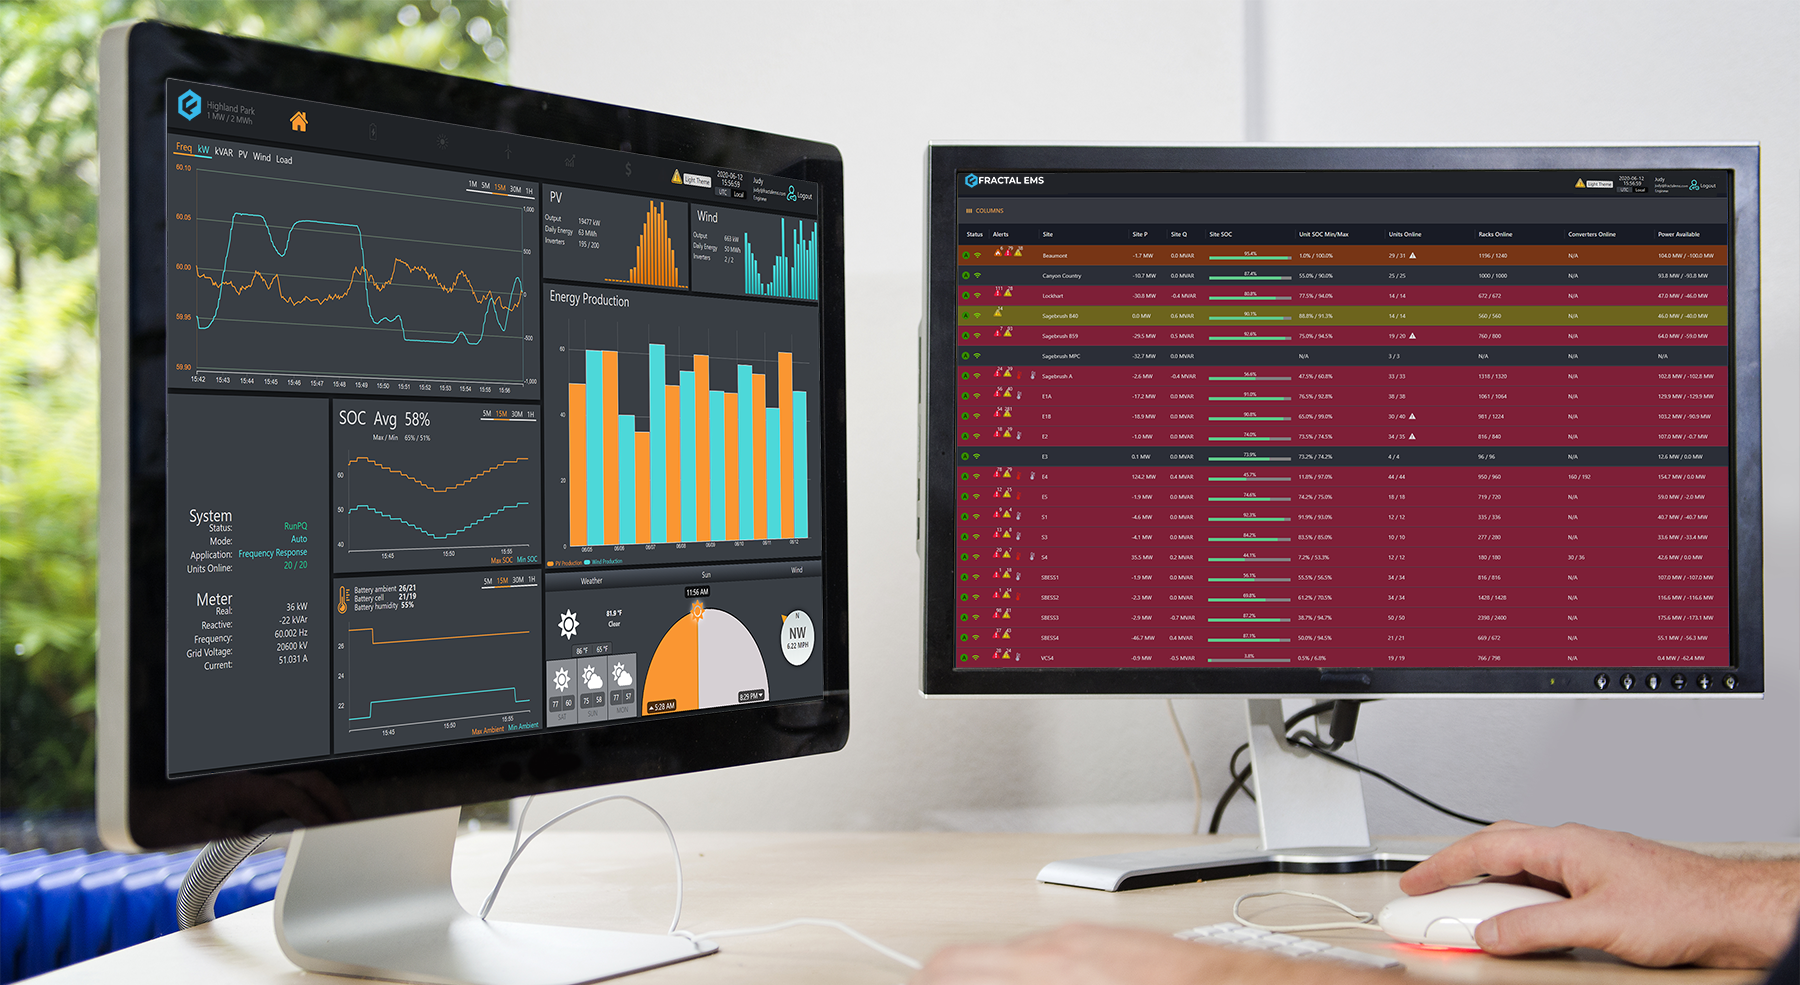
One interface to run your whole fleet
A flexible, scalable architecture lets you add, remove, or change assets and dispatch a single site or your entire portfolio while reliably managing your fleet.
Open, modular platform — control multiple sites with 100+ inverters
Add, remove, or change assets as your portfolio evolves
Dispatch a single asset or your entire portfolio
Fleet-level view of your whole portfolio at a glance
Standardize on one EMS across every project
Remote system operations
Open/close site-level switchgear & breakers
Open/close inverter breakers (AC & DC)
Open/close battery rack contactors
Switch operating modes & reset PCS
Update parameters & setpoints in real time (local & remote)
Diagnose faults & review bit status codes
Issue an emergency stop (E-Stop)
Automatically & remotely deploy fire suppression
Custom BOP control algorithms & optimization available
Receive & acknowledge faults, warnings & alarms
Alarms & warnings
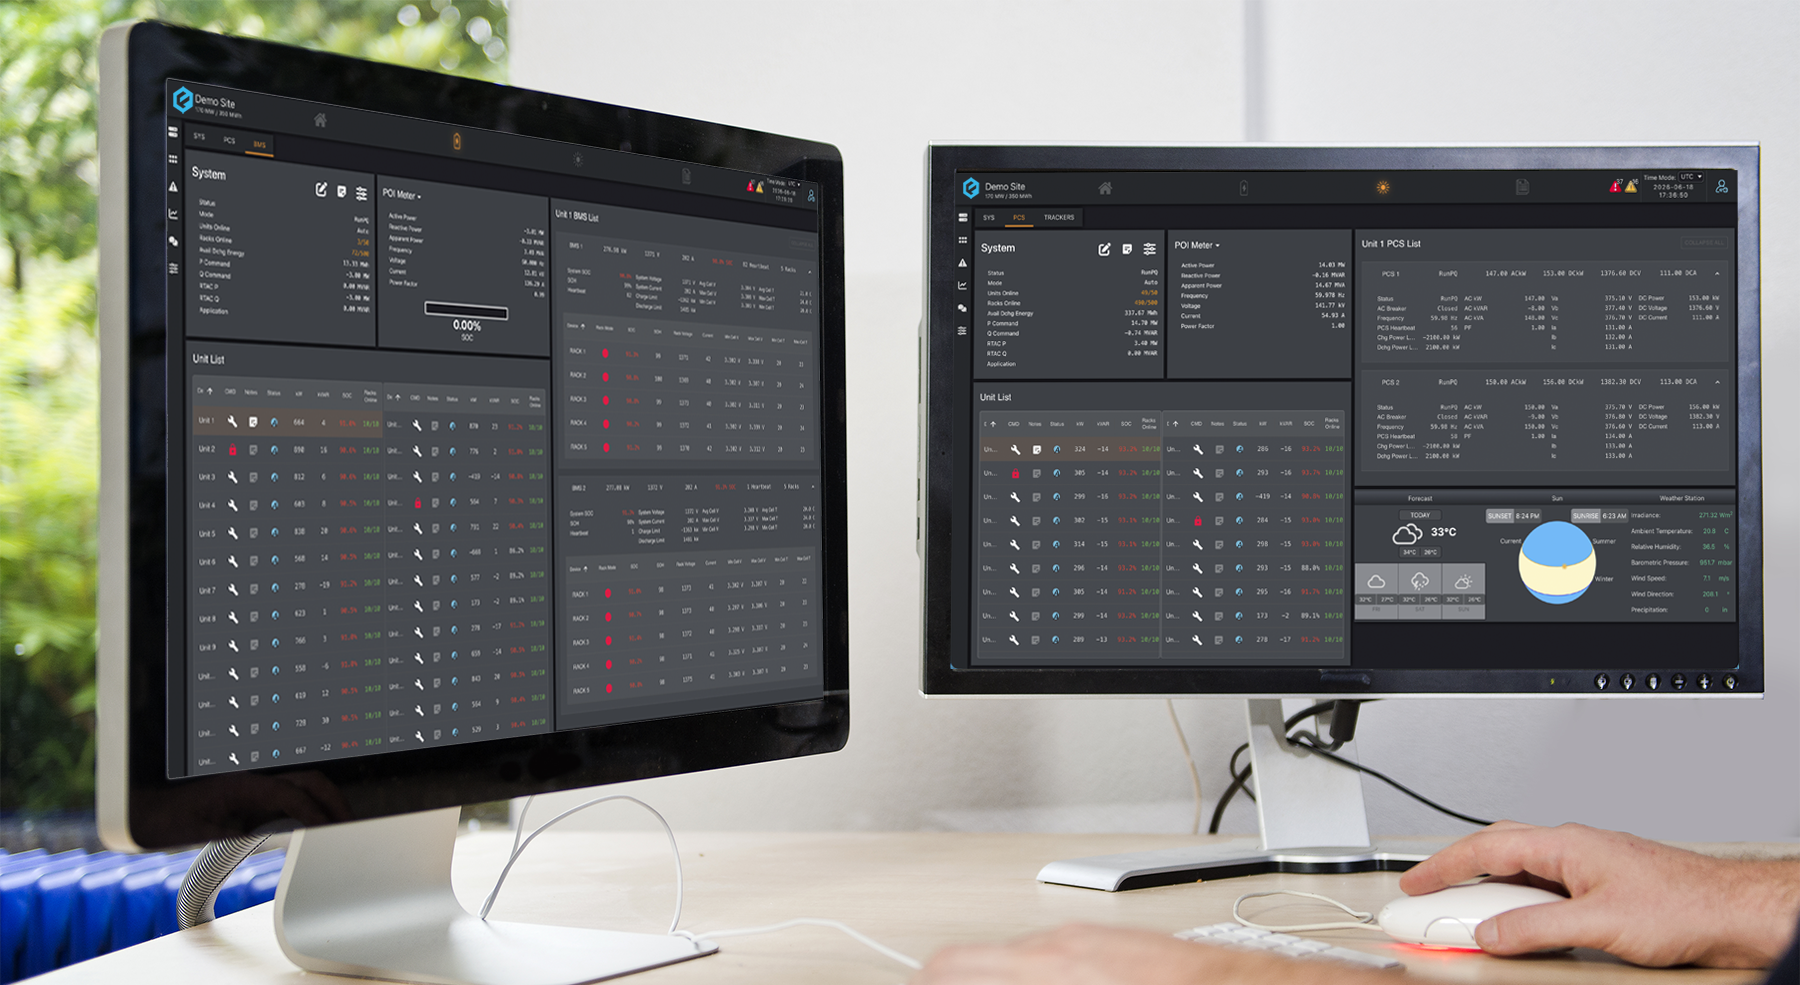
Over/under-temperature & voltage thresholds
Malfunctions of PCS & BMS
Ground faults
Loss of communications
Open container doors
Interlock activations (racks, DC isolation switch)
HVAC, fire-suppression & other BOP alarms
Control modes

Manual Schedule
Stack up to ten apps via the Fractal Calendar.

Monitor & Respond
React to load, pricing or SCADA (AGC).

Measure & Respond
React to frequency, solar/wind power & voltage.

Receive & Respond
Take commands via SCADA (AGC) or API.
Monitoring, control & diagnostics
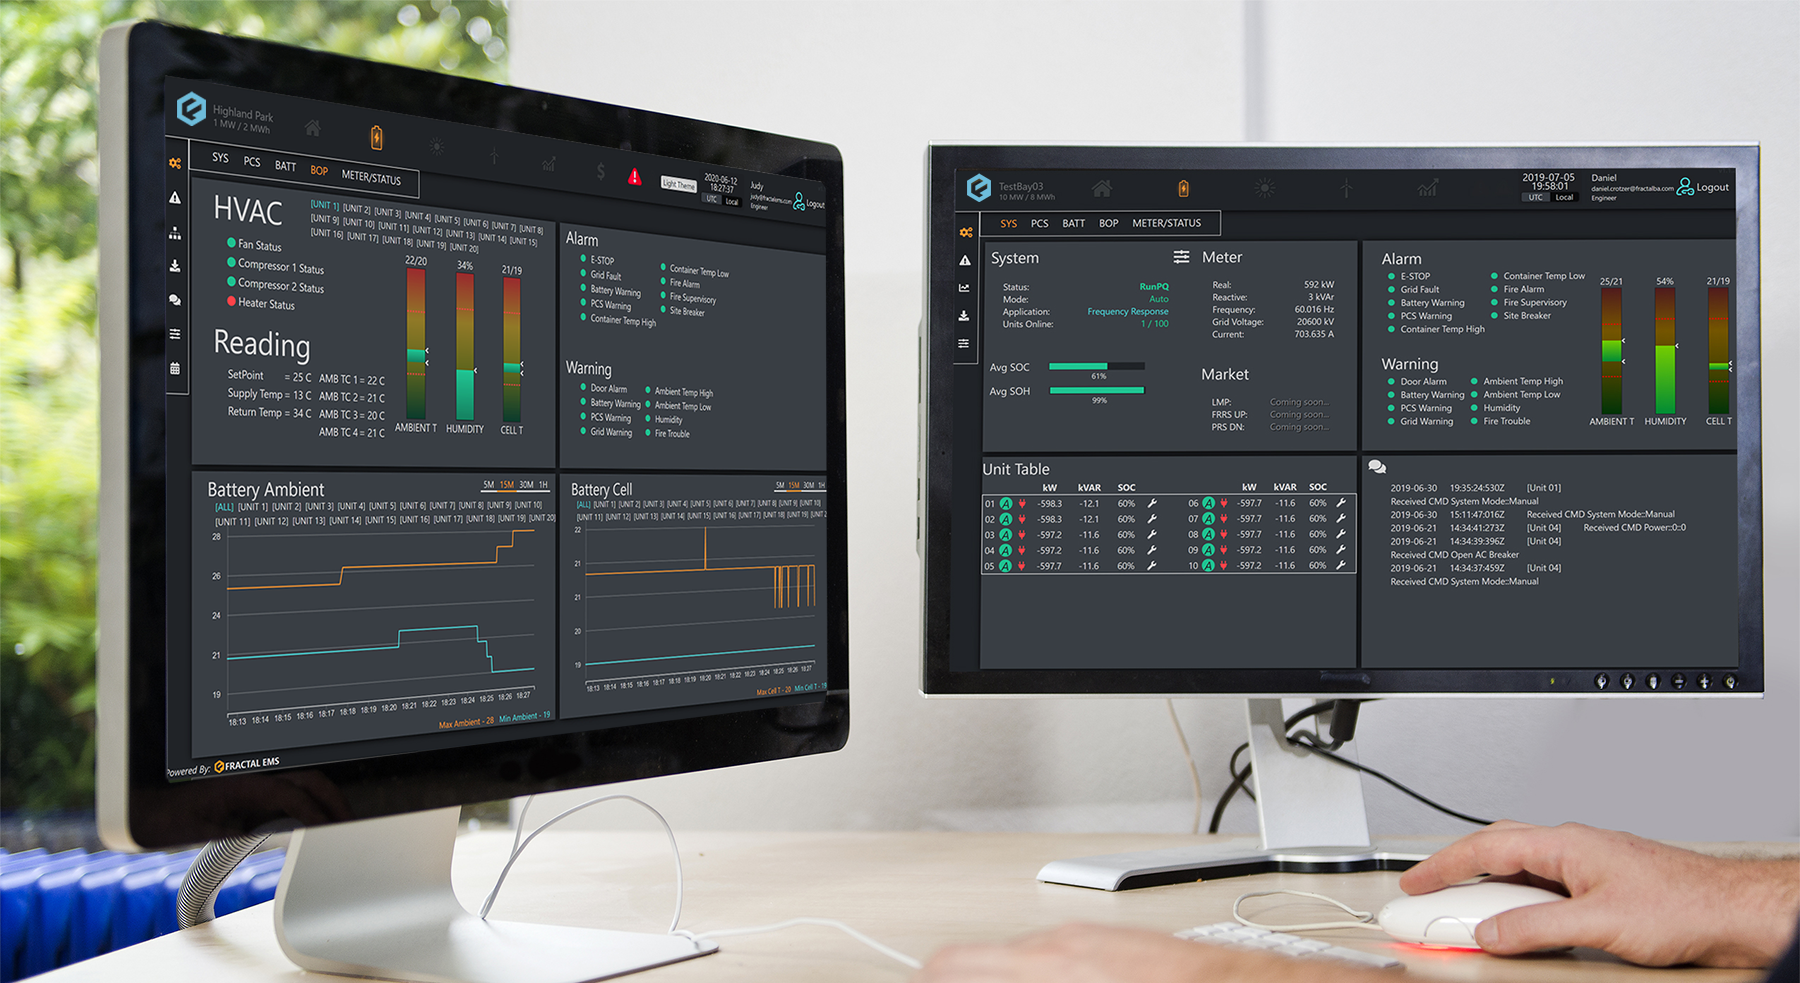
See everything, live
Real-time monitoring of performance via a secure, encrypted web UI
Keeps the system within manufacturer-defined safe limits
Responds to temperatures or abnormalities by reducing output or stopping
Optimizes operation — SOC bands, temperatures & power levels
Faults, warnings & alarms with diagnostic tools to maintain availability
State of health at system, string & rack level, with 100 ms streaming
Communication & control schemes

Cloud Dispatch
Fractal Calendar, API commands, ADS (CAISO) & Optimizer invites.

Utility SCADA Dispatch
Securely receive P/Q commands from SCADA.

Local Dispatch
Site Controller responds autonomously to local measurements.
40+ stackable applications
Fractal EMS ships with a deep library of customizable applications — and you build the strategy. Configure it all from the HMI.
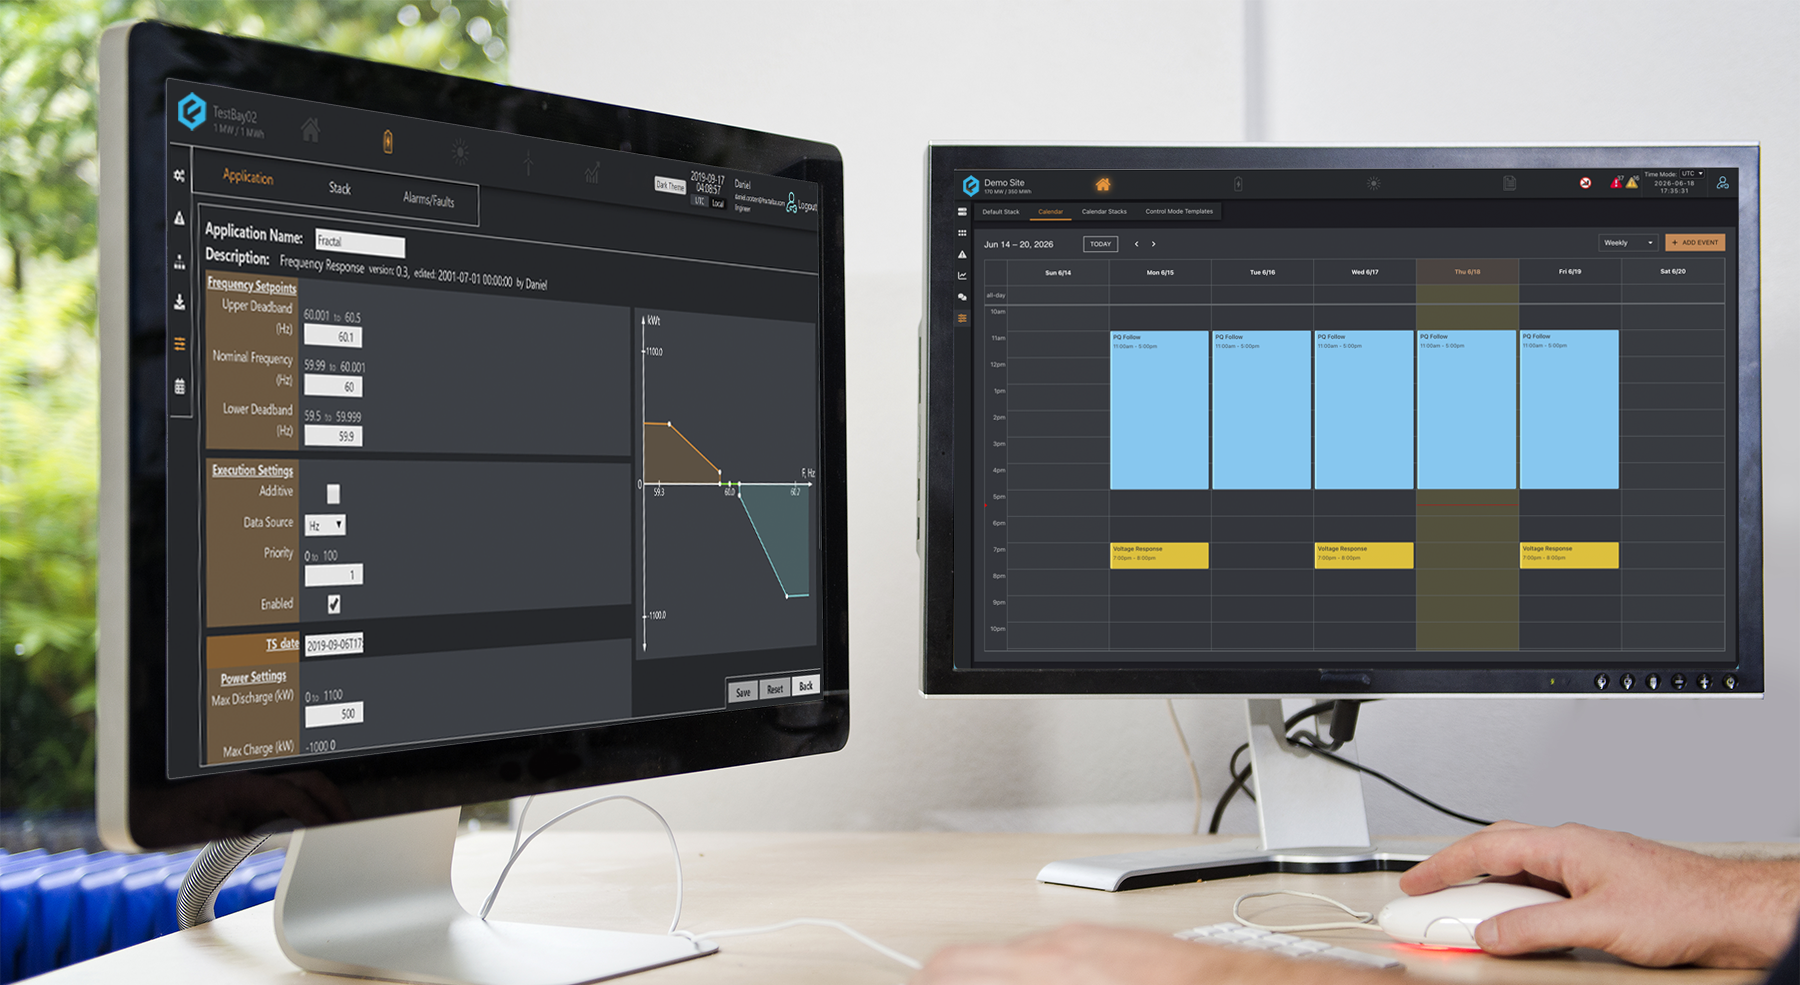
Stack, prioritize & schedule
Run applications concurrently as prioritized stacks
Allocate a percentage of the asset to each (e.g., 60% / 40%)
Prioritize apps and configure individual parameters
Schedule by day, hour, or 24/7
Switch via the scheduler or a live dispatch signal
Manual Active/Reactive Power
POI/POM Limits
External Active Power Control
Site-level SOC Balancing / Biasing
TOU Energy Shifting
Energy Arbitrage / Peak Shaving
Primary Frequency Response (PFR)
Fast Frequency Response (FFR/FFRS)
Automatic Governor Control (AGC) Response
Volt / VAR Support
Automatic Voltage Regulator (AVR)
Maintenance Mode
Automated Battery Balancing
Target SOC / SOC Management
ADS API Integration
Power / Rate Limiting
Demand Charge Mitigation
T&D Deferral
Third-Party Data Integration
Power Smoothing / Ramp Rate Control
PV-Only Control
DC-Coupled PV+S Controls
Selective Solar Charging
Solar Firming
Solar Shedding
Co-located Solar Controls
Solar Curtailment
Clipping Recapture
MET Station Integration
Tracker Integration
Substation Breaker Control
Substation Capacitor Bank Control
Backup Generator Failover
Load Tap Changer (LTC) Controls
Black-Start
Grid Forming Support
Power Oscillation Dampening (POD)
Multiple Metering Integration
Camera System Integration
HVAC Inhibit Logic
First Responders Panel (FRP)
Historian, data & reporting
Fractal EMS includes a data historian and custom report builder, hosting your data in our secure cloud — which manages storage, network security, node clustering and data replication for high reliability, performance and availability. Time-series data (typically 300–1,000 points per inverter) is available for all system equipment: PCS, battery racks and BMS, unit controllers, meters, sensors, fire panels, thermal management, switchgear, transformers and generators. All data is encrypted (including customer-provided data) and hosted with separate permissions for privacy and security.
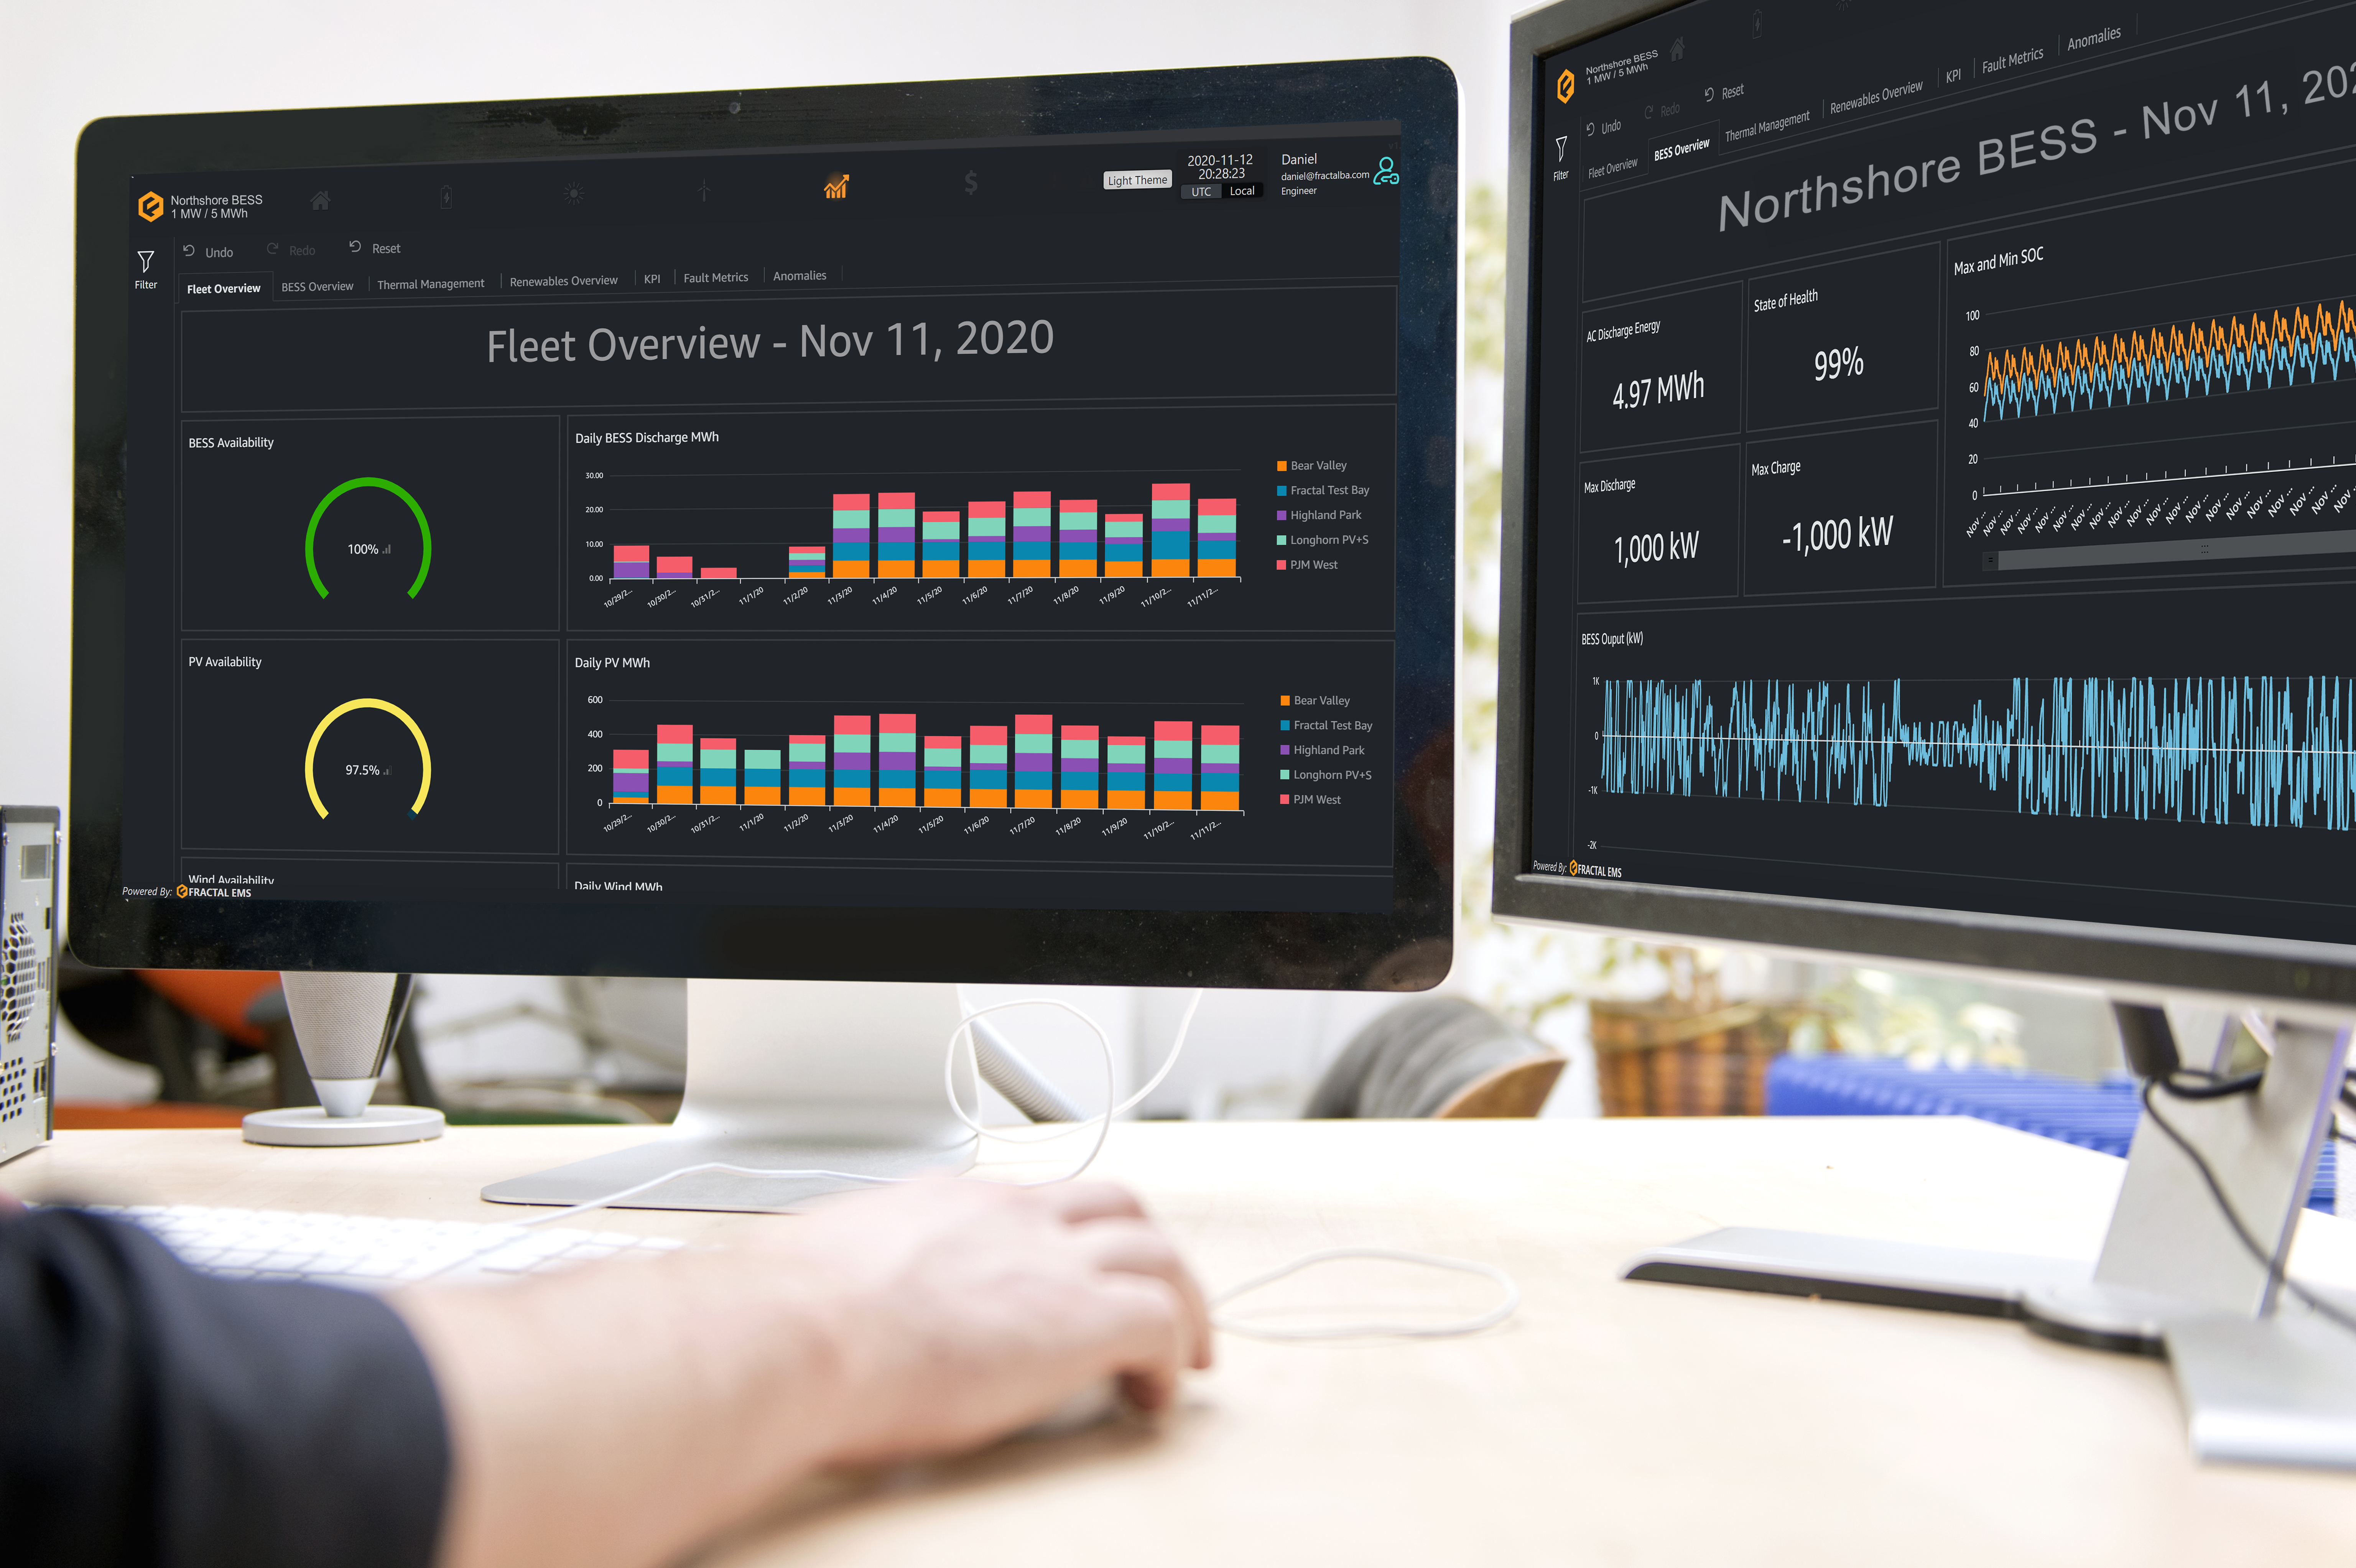
High-resolution capture & custom reporting
1-second to 10-second capture, plus 50 samples/s high-speed
Custom report builder with interactive visualizations
Feeds warranty claims & predictive-failure models
Retained for the duration of the service agreement
Local Historian
On-site storage of site-wide telemetry for 3 to 12 months, for high-resolution diagnostics and trend analysis.
Remote Historian (Cloud)
Secure cloud-based data archiving, maintained for the duration of the service agreement.
MQTT Data Server
Industry-standard MQTT interface for seamless third-party data ingestion and integration — all points available.
Anomaly detection and analytics
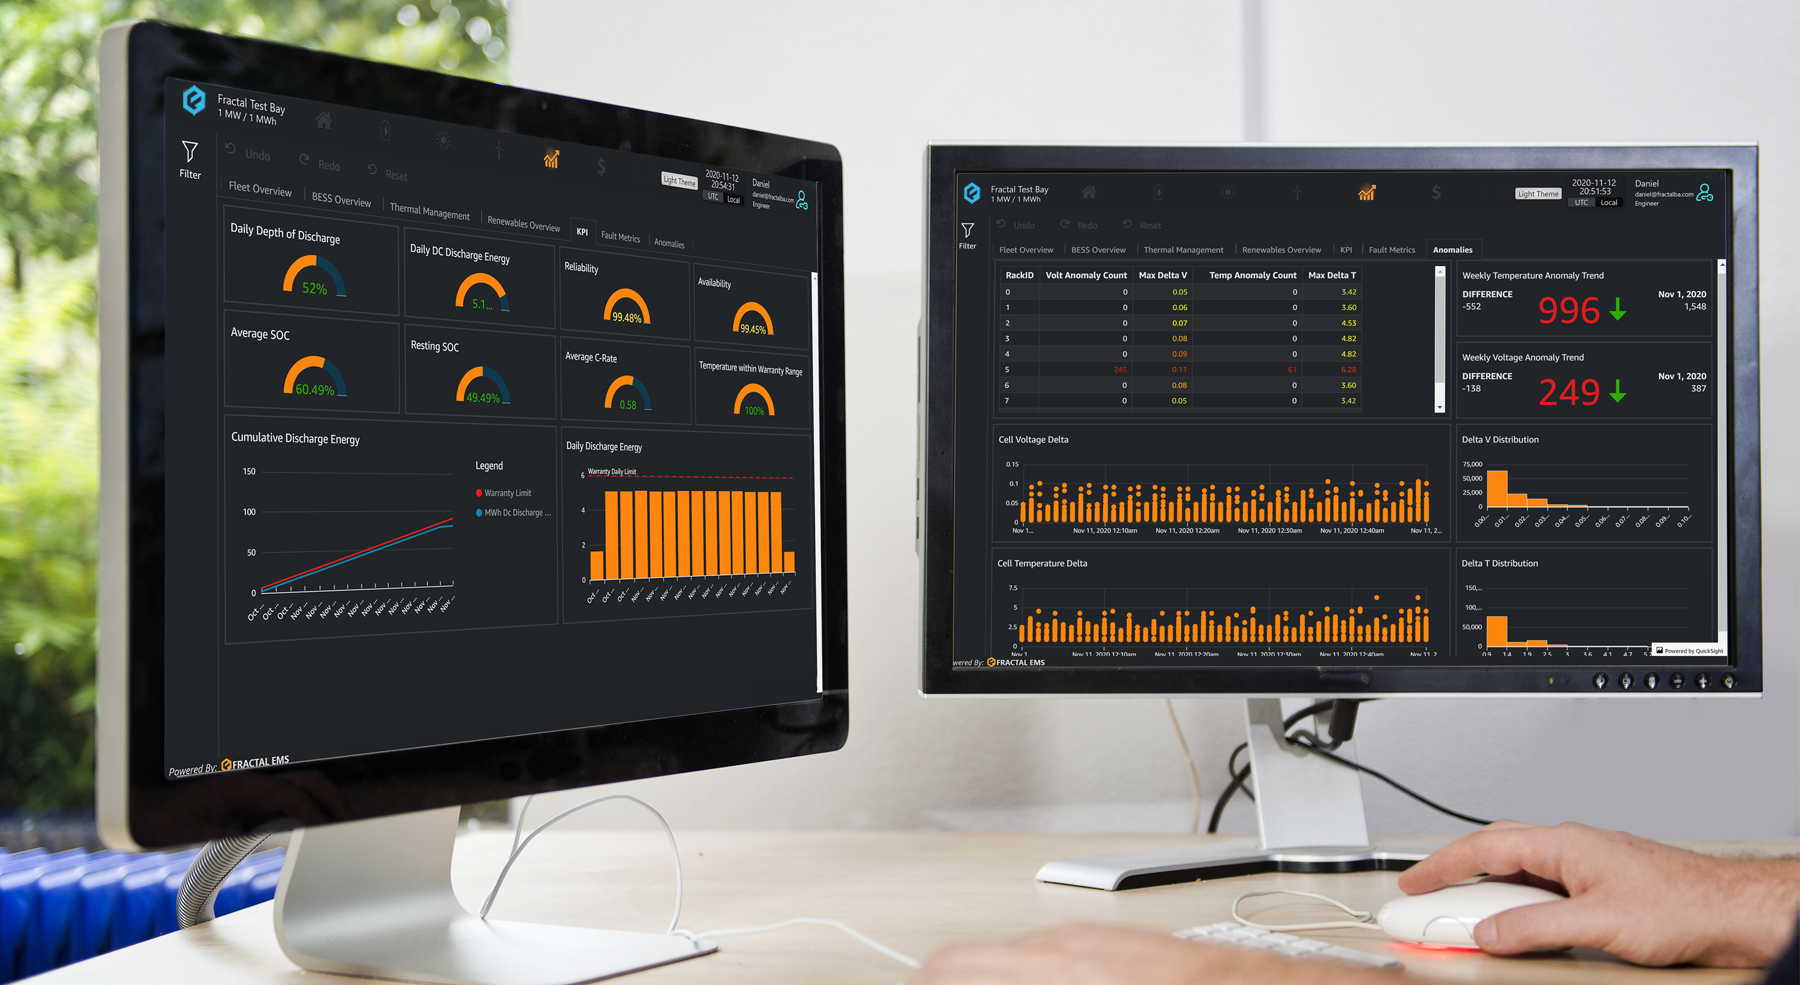
Fleet and asset analytics
Track & report performance KPIs and trends at fleet, site & equipment level
Automated, customizable reports & notifications
Machine learning identifies weak batteries and fire risks
Tracks state of health and the key factors driving degradation
Digital twin simulates degradation to minimize augmentations
Flags equipment with reduced efficiency or higher runtimes
Schedule preventative maintenance before it becomes downtime
Want a live walkthrough of the HMI?
Request a proposal